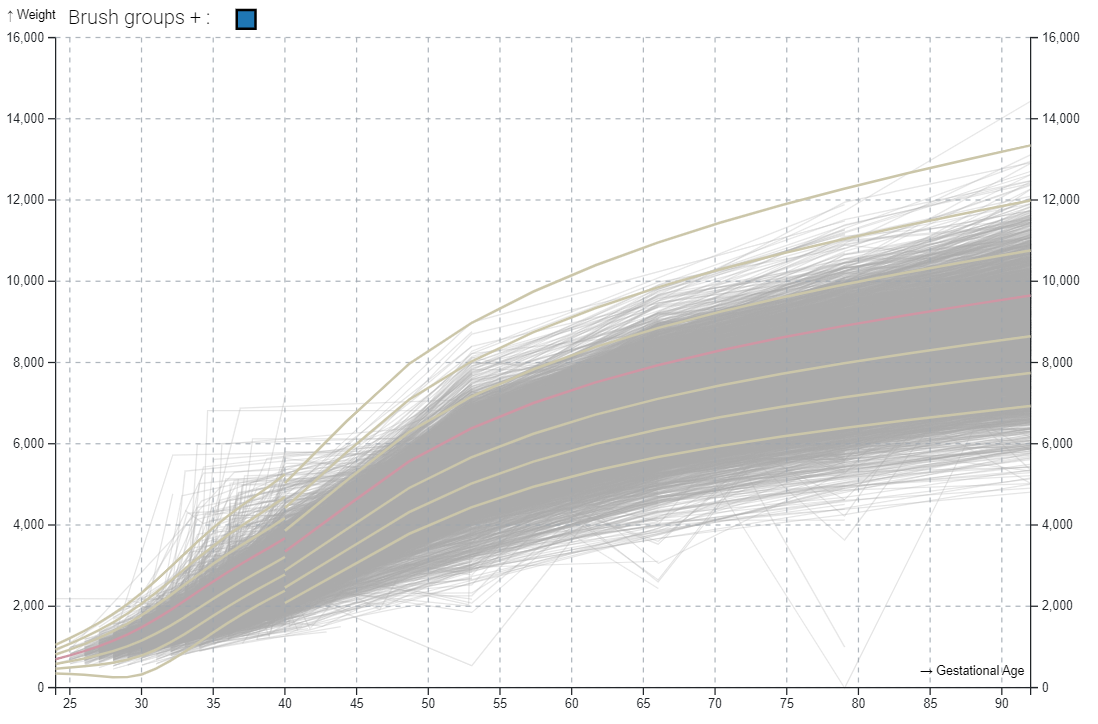
You can use it to visualize thousands of time series, and select multiple groups by direct manipulation. In addition, it works as a reactive widget that can be added to other applications, returning the selected groups in real time.
| Group Selection | Detailed View | Reference Lines |
|---|---|---|
 |
 |
 |
Try it!
You can test timeSearcher+ right now with your own CSV data (less than 200MB), in TimeSearhcer+: Test your own data
Or you can test it with the KMC weights data, in TimeSearcher+: KMC weights
Install
npm install anonymized Requires ^popper.js@2.11.6, ^d3@7.8.2 and ^htl@0.3.1.
Step by step
- HTML. Start with this template
- Import TimeSearcher+. Create and import a new JavaScript file below the scripts (d3, Popper and TimeSearcher+) or right in the html like in the example below
- Create a TimeSearcher+ Instance.
- [Optional] Configure TimeSearcher render.
- Set the data. The file containing the reference lines will be a json file with the following definition:
Source Code
The widget code is available here
To compile the code you should follow the instructions:
Go to the package download location
Install the project
At this point you should have the project compiled in the folder dist, with the files
- timeSearcher.esm.js
- TimeSearcher.js
- TimeSearcher.min.js
License
TimeSearcher+.js is licensed under the MIT license. (http://opensource.org/licenses/MIT)e
Why this page?
This page has been created to maintain anonymity in the process of submitting a short-paper to ieeevis. This documentation is also available in the code repository on github (which we do not link to maintain anonymity) and on the NPM page.